Cập nhật lần cuối: Tháng 6 năm 2026
Dự báo giá vàng năm 2030 là gì?
Dự báo giá vàng năm 2030 dao động từ 4.000 USD đến hơn 10.000 USD mỗi ounce, chịu tác động từ nhu cầu của ngân hàng trung ương, lãi suất thực và sự suy yếu của USD. Hầu hết các mô hình phân tích đều tập trung trong khoảng 4.000 – 7.000 USD.
Dự báo giá vàng năm 2030 dao động từ 4.000 USD đến hơn 10.000 USD mỗi ounce, chịu tác động từ nhu cầu của ngân hàng trung ương, kỳ vọng lạm phát và sự suy yếu mang tính cấu trúc của USD. Hầu hết các kịch bản đáng tin cậy từ chuyên gia đều tập trung trong khoảng 4.000 – 7.000 USD, với các kết quả cực đoan có thể xảy ra theo cả hai hướng tùy thuộc vào cách các biến số kinh tế vĩ mô chính diễn biến trong bốn năm tới.
Bài viết này đề cập đến vị thế hiện tại của vàng, các yếu tố đang chi phối giá, quỹ đạo diễn biến theo từng năm, ba kịch bản cụ thể cho năm 2030, dự báo của các chuyên gia phân tích lớn, và cách các nhà giao dịch tiếp cận vàng thông qua XAUUSD trên MT4/MT5.
Vàng năm 2026 — Điểm khởi đầu
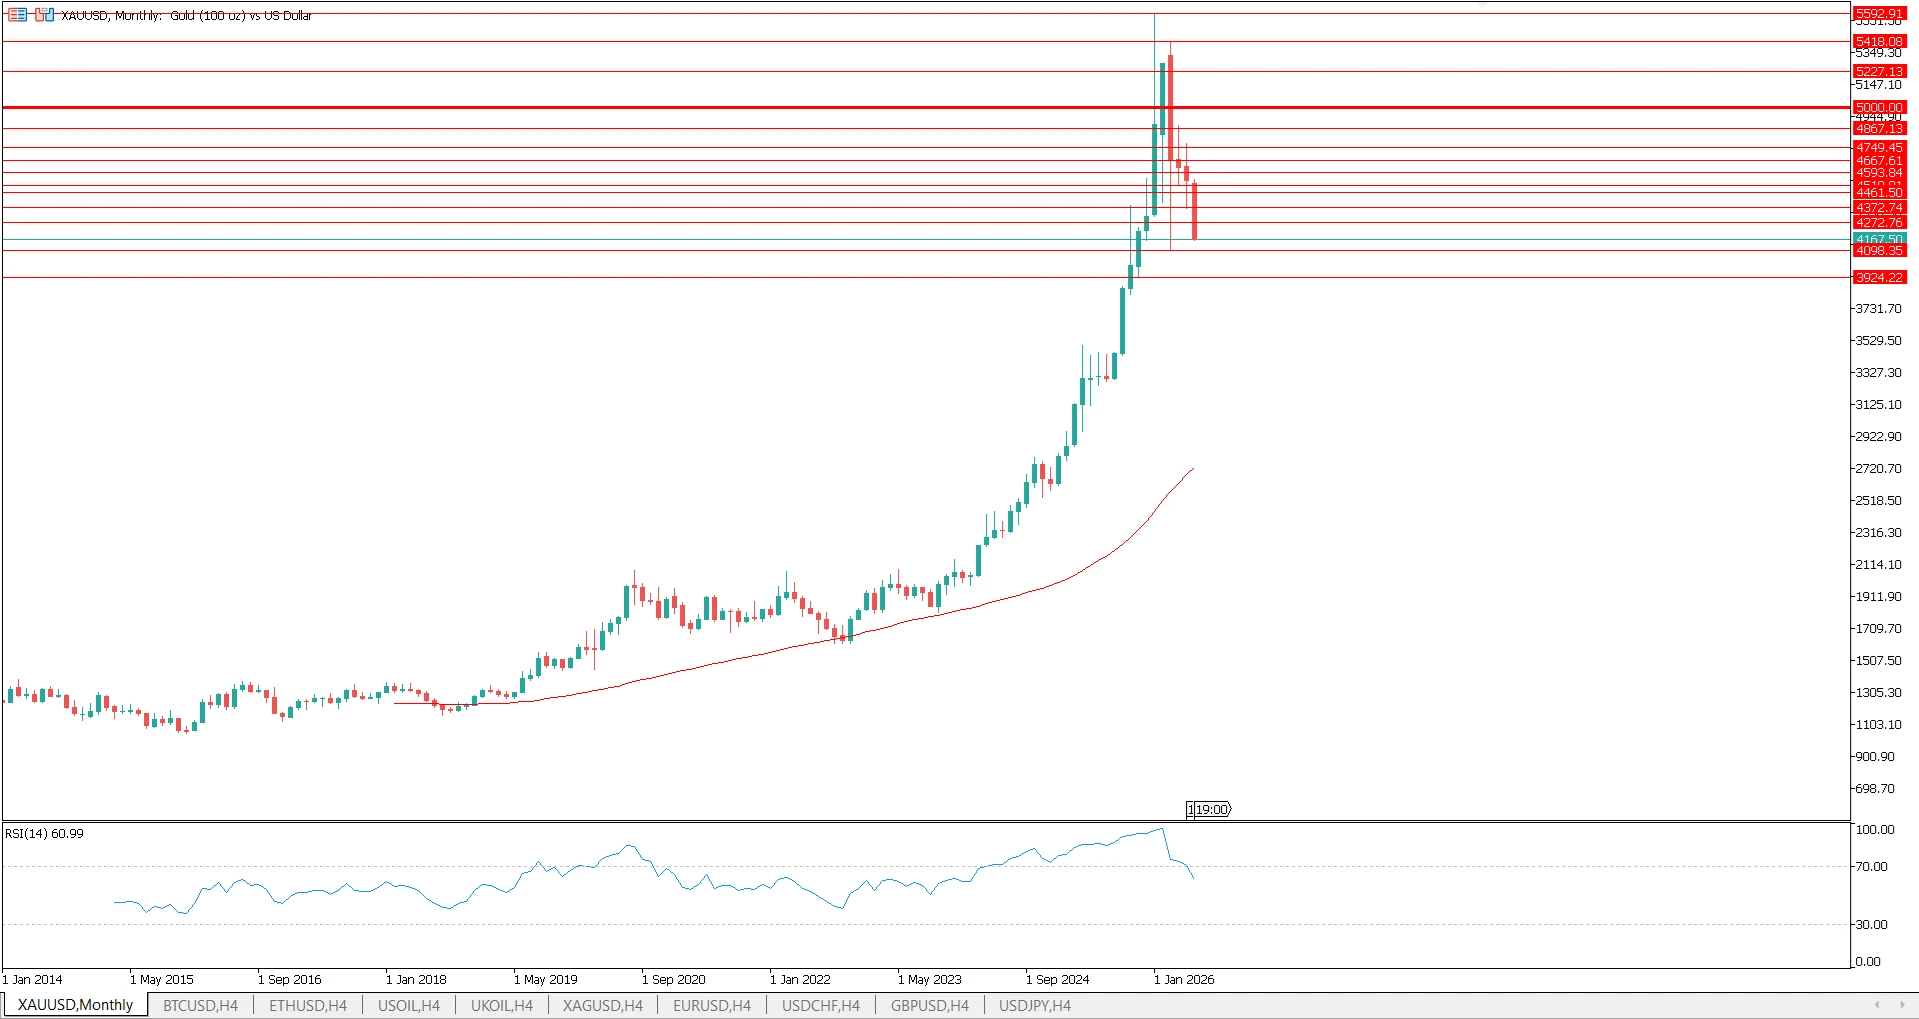
Tính đến tháng 6 năm 2026, XAUUSD giao dịch ở mức khoảng 4.173 USD mỗi ounce — đã hơn gấp đôi mức đáy năm 2022. Vàng đã đạt mức cao nhất lịch sử là 5.592 USD vào tháng 1 năm 2026 trước khi điều chỉnh giảm khoảng 25% do hoạt động chốt lời và sự phục hồi tạm thời của USD.
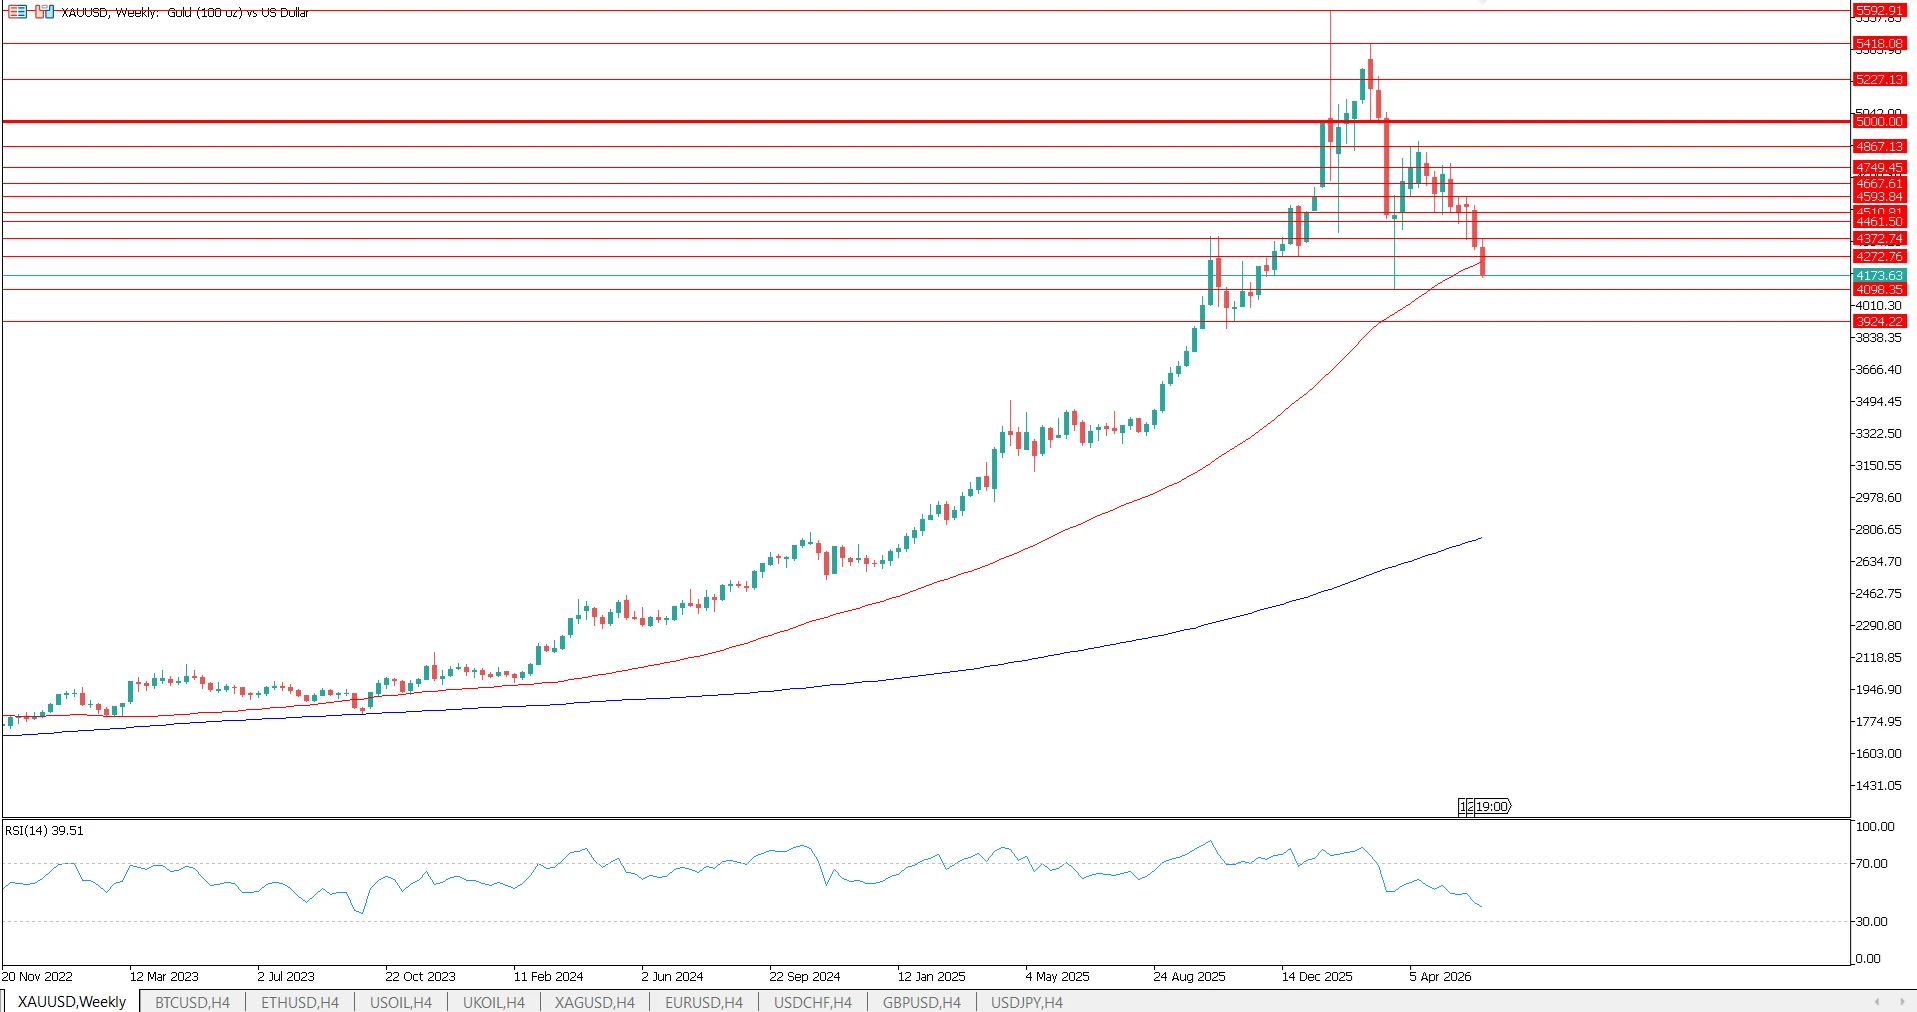
Tính theo năm, vàng đã tăng khoảng 28% trong năm 2026. Điều này tiếp nối mức tăng trưởng vượt trội của năm 2025 — vàng đã tăng hơn 70% trong năm, mức tăng hàng năm mạnh nhất kể từ năm 1979. Kể từ năm 2000, vàng đã vượt trội hơn trái phiếu Chính phủ Mỹ, cổ phiếu Mỹ, cổ phiếu các thị trường phát triển và các thị trường mới nổi — một chuỗi tăng trưởng phi thường đối với một tài sản không trả lợi suất.
Một số yếu tố mang tính cấu trúc đã được phản ánh vào mức giá hiện tại:
- Ba năm liên tiếp ngân hàng trung ương mua ròng trên 800 tấn, cao hơn hẳn mức trung bình hàng năm 473 tấn trong giai đoạn 2010–2021 (Hội đồng Vàng Thế Giới)
- Câu chuyện phi đô la hóa: các ngân hàng trung ương thị trường mới nổi đang giảm dần tỷ trọng dự trữ bằng USD để chuyển sang vàng
- Nhu cầu phòng ngừa lạm phát: các nhà đầu tư tổ chức và cá nhân coi vàng là công cụ ổn định danh mục trong môi trường lạm phát kéo dài
Điều chưa được phản ánh vào giá là bốn năm tới. Đây chính là phần phân tích thú vị.
Vì sao giá vàng đang tăng — Các yếu tố vĩ mô chính
Nhu cầu từ ngân hàng trung ương
Thay đổi mang tính cấu trúc quan trọng nhất trên thị trường vàng trong bốn năm qua là hành vi của các ngân hàng trung ương. Chỉ riêng trong quý 1 năm 2026, các ngân hàng trung ương đã mua ròng 244 tấn — tăng 3% so với cùng kỳ năm trước và là tốc độ mua theo quý nhanh nhất trong hơn một năm. Theo Hội đồng Vàng Thế Giới, 43% các ngân hàng trung ương hiện có kế hoạch tăng dự trữ vàng trong năm 2026, tăng so với 29% chỉ hai năm trước.
Ngân hàng Quốc gia Ba Lan đã bổ sung 102 tấn vào năm 2025, nâng dự trữ lên 550 tấn. Trung Quốc, Nga, Ấn Độ và Kazakhstan vẫn tiếp tục là những bên mua thường xuyên. Dự báo cả năm 2026 của Hội đồng Vàng Thế Giới ở mức khoảng 850 tấn — vẫn hơn gấp đôi mức trung bình hàng năm trước năm 2022.
Đây không phải là hoạt động mua mang tính chu kỳ. Nó phản ánh sự tái cân đối mang tính cấu trúc của các danh mục dự trữ, rời khỏi các tài sản định giá bằng USD, và tạo ra một mức sàn nhu cầu ổn định mà hầu hết các thị trường hàng hóa khác không có được.
Sự suy yếu của USD và phi đô la hóa
Vàng và đô la Mỹ có tương quan nghịch. Khi USD suy yếu, giá vàng tính bằng USD sẽ tăng. Môi trường hiện tại — thâm hụt tài khóa lớn của Mỹ, tỷ lệ nợ trên GDP cao, và sự phân mảnh địa chính trị của hệ thống thanh toán dựa trên USD — mang tính cấu trúc tiêu cực đối với USD trong trung hạn.
Phi đô la hóa không phải là một sự kiện nhị phân diễn ra trong ngắn hạn. Đó là một quá trình diễn biến chậm: nhiều hoạt động thương mại song phương hơn được thanh toán bằng các đồng tiền không phải USD, nhiều dự trữ quốc gia hơn được đa dạng hóa khỏi trái phiếu Chính phủ Mỹ, và nhu cầu ngày càng tăng đối với các phương tiện lưu trợ giá trị trung lập. Vàng là bên hưởng lợi chính từ sự chuyển dịch này.
Lãi suất thực
Tương quan nghịch đáng tin cậy nhất trên thị trường vàng là với lãi suất thực — lợi suất trái phiếu Chính phủ Mỹ trừ đi lạm phát kỳ vọng. Khi lãi suất thực giảm hoặc chuyển sang âm, giá vàng tăng. Khi lãi suất thực tăng vọt, giá vàng điều chỉnh giảm.
Charlie Morris của Atlantic House Investments, viết trên LBMA Alchemist (Số 97), mô hình hóa vàng như một loại trái phiếu không lãi suất định kỳ, gắn với lạm phát và không có rủi ro. Khung phân tích của ông cho thấy động lực chính thúc đẩy mức tăng của vàng kể từ năm 2000 là sự sụt giảm lãi suất thực kéo dài nhiều thập kỷ — từ trên 4% vào năm 2000 xuống mức âm sâu. Nếu kỳ vọng lạm phát dịch chuyển về mức 4% trong khi Fed vẫn kìm giữ lợi suất danh nghĩa, mô hình của Morris cho thấy giá trị hợp lý cao hơn đáng kể so với mức giá hiện tại.
Phần bù rủi ro địa chính trị
Bất ổn địa chính trị đã trở thành một lực cầu mang tính cấu trúc bền vững thay vì chỉ là một cú tăng tạm thời. Các cuộc xung đột, các chế độ trừng phạt và sự dịch chuyển liên minh khiến một phần vốn toàn cầu tiếp tục được phân bổ vào vàng như một tài sản trung lập, không có rủi ro đối tác. Phần bù này có vẻ sẽ tồn tại lâu dài chừng nào sự phân mảnh địa chính trị còn tiếp diễn.
Để biết phân tích chi tiết về cách các dữ liệu kinh tế và các sự kiện địa chính trị tác động đến giá XAUUSD trong thực tế, xem Các yếu tố cơ bản và tin tức kinh tế tác động đến giá vàng.
Dự báo giá vàng theo năm (2026–2030)
Biên độ theo từng năm dưới đây phản ánh sự đồng thuận của các chuyên gia phân tích và mô hình hóa kịch bản kinh tế vĩ mô. Đây là các khoảng biên độ, không phải mục tiêu cụ thể — quỹ đạo thực tế sẽ phụ thuộc vào chính sách của Fed, lạm phát và mức độ ưa thích rủi ro toàn cầu.
Năm | Biên độ dự báo (USD/oz) | Biến số chính |
2026 | 3.800 – 5.400 USD | Hướng chính sách của Fed, quỹ đạo USD |
2027 | 4.500 – 6.000 USD | Tốc độ chu kỳ cắt giảm lãi suất, dòng vốn vào ETF |
2028 | 4.500 – 7.000 USD | Nhu cầu ngân hàng trung ương, tác động chu kỳ bầu cử |
2029 | 4.000 – 7.500 USD | Triển vọng USD, giai đoạn rủi ro suy thoái tiềm ẩn |
2030 | 2.500 – 10.000+ USD | Biên độ đầy đủ theo kịch bản (xem bên dưới) |
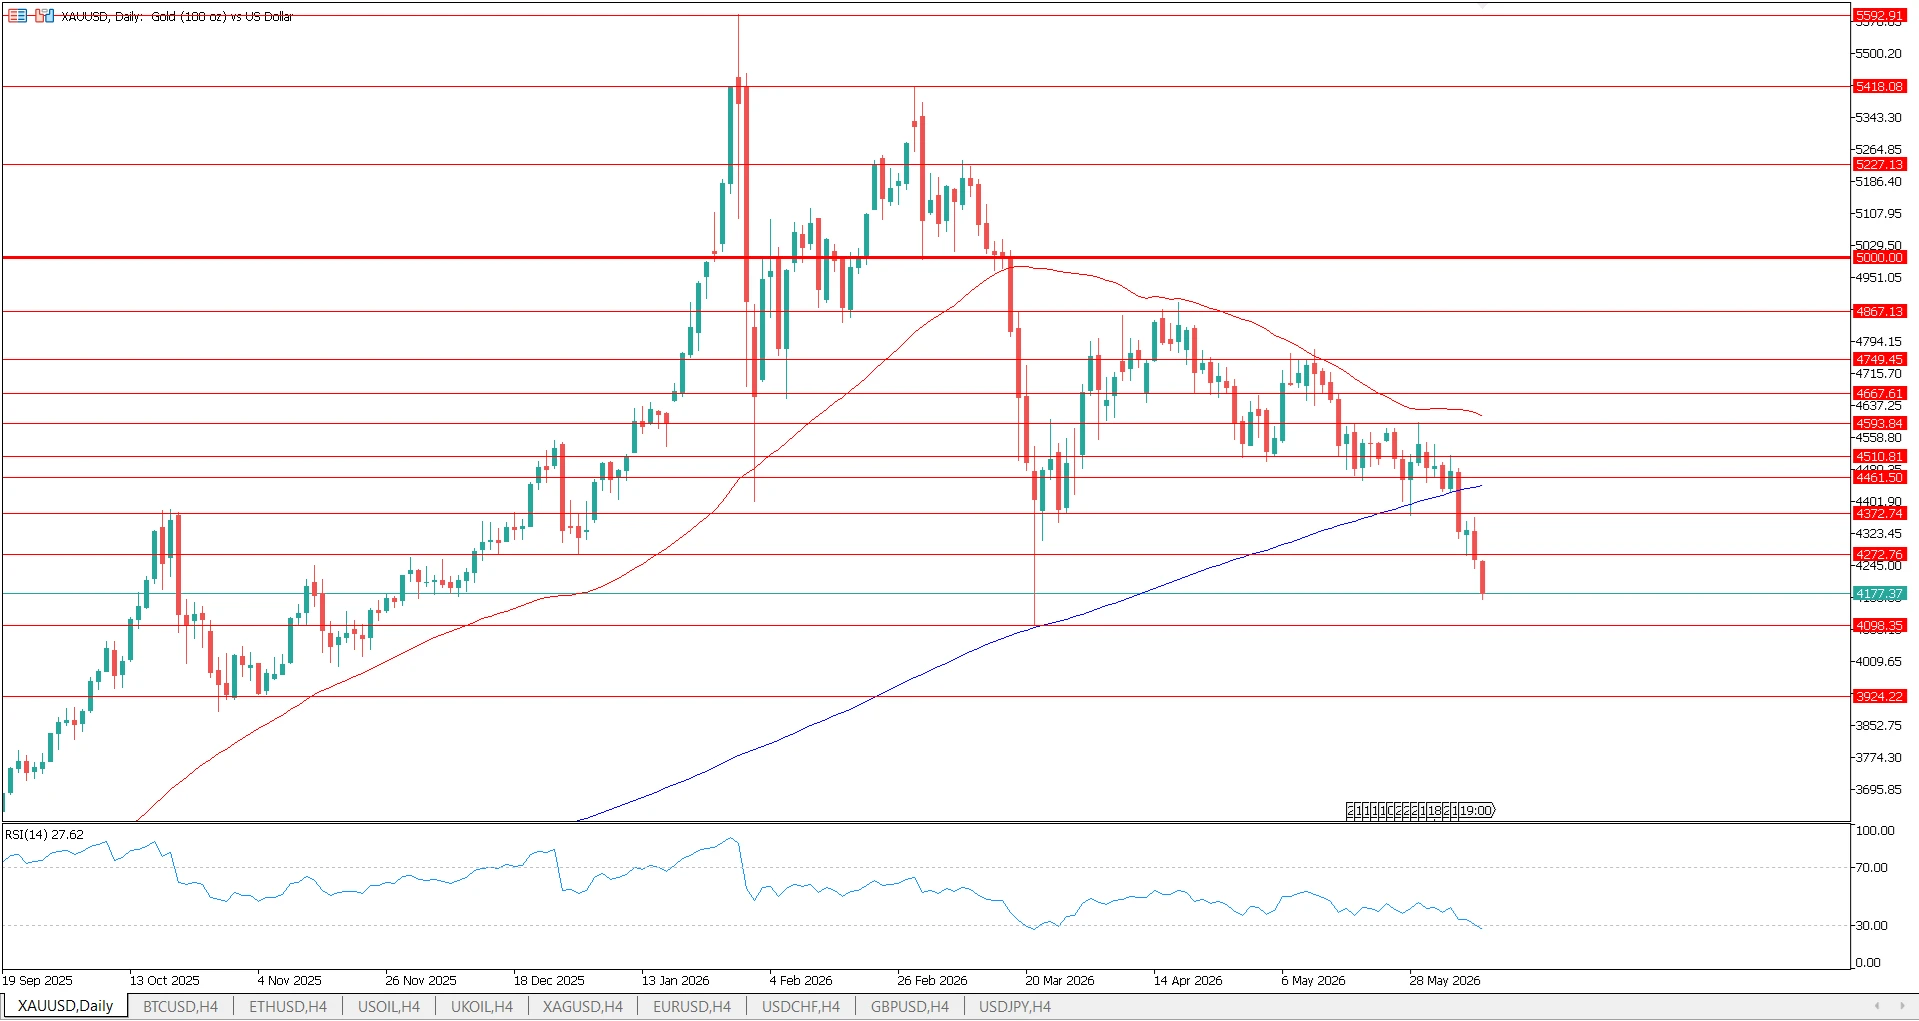
2026: Vàng đang trong giai đoạn điều chỉnh mạnh từ mức cao nhất lịch sử vào tháng 1 năm 2026, hiện giao dịch gần mức 4.168 USD với chỉ số RSI hàng ngày rơi sâu vào vùng quá bán ở mức 27. Từ mức đỉnh lịch sử 5.592 USD, vàng đã điều chỉnh giảm khoảng 25%. JPMorgan Global Research trước đó đã dự báo XAUUSD sẽ đạt mức trung bình 5.055 USD vào quý 4 năm 2026 — một mức đòi hỏi sự phục hồi đáng kể so với giá hiện tại. Biến số chính là liệu Fed có tiếp tục cắt giảm lãi suất hay giữ nguyên. Một sự chuyển hướng ôn hòa sẽ thúc đẩy lực cầu vàng; một chu kỳ tăng lãi suất bất ngờ sẽ khiến giá vàng thu hẹp thêm.
2027: Nếu chu kỳ cắt giảm lãi suất diễn ra nhanh hơn như các mô hình dự báo, dữ liệu lịch sử cho thấy vàng phản ứng với độ trễ từ 12–18 tháng. Các chu kỳ sau khi cắt giảm lãi suất trong giai đoạn 2001–2002 và 2007–2009 đã ghi nhận mức tăng giá vàng từ 30–60% trong vòng hai năm kể từ lần cắt giảm đầu tiên.
2028: Các dự báo về nhu cầu của ngân hàng trung ương vẫn duy trì ở mức cao. Dòng vốn vào ETF, vốn đã tụt hậu so với nhu cầu vàng vật chất trong giai đoạn 2023–2025, đã bắt đầu phục hồi — các chuyên gia phân tích cho rằng sự phân bổ thêm từ các nhà đầu tư tổ chức có thể tạo thêm áp lực tăng giá đáng kể.
2029: Các kịch bản về sự suy yếu của USD cho thấy vàng sẽ tiếp tục duy trì sức mạnh. Một số mô hình kinh tế cảnh báo giai đoạn 2028–2029 có rủi ro suy thoái cao hơn, điều này về mặt lịch sử sẽ hỗ trợ cho vàng với vai trò là tài sản trú ẩn an toàn.
2030: Tổng hợp biên độ. Các chiến lược gia của JPMorgan cho biết vàng có thể đạt 8.000 USD vào cuối thập kỷ trong kịch bản tích cực của họ, trong khi dự báo cấu trúc dài hạn của JPMorgan đã được nâng lên mức cơ sở là 4.500 USD/oz. Biên độ đầy đủ phản ánh cách các kết quả kinh tế vĩ mô khác nhau tương ứng với các mức giá khác nhau.
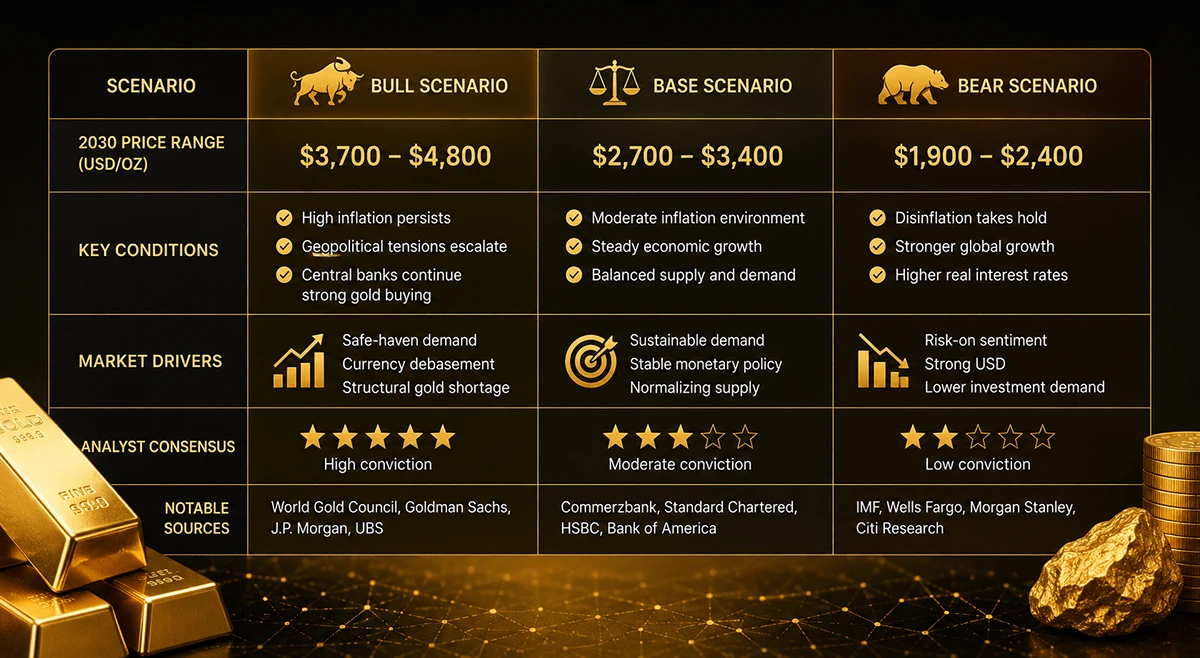
3 kịch bản cho vàng năm 2030
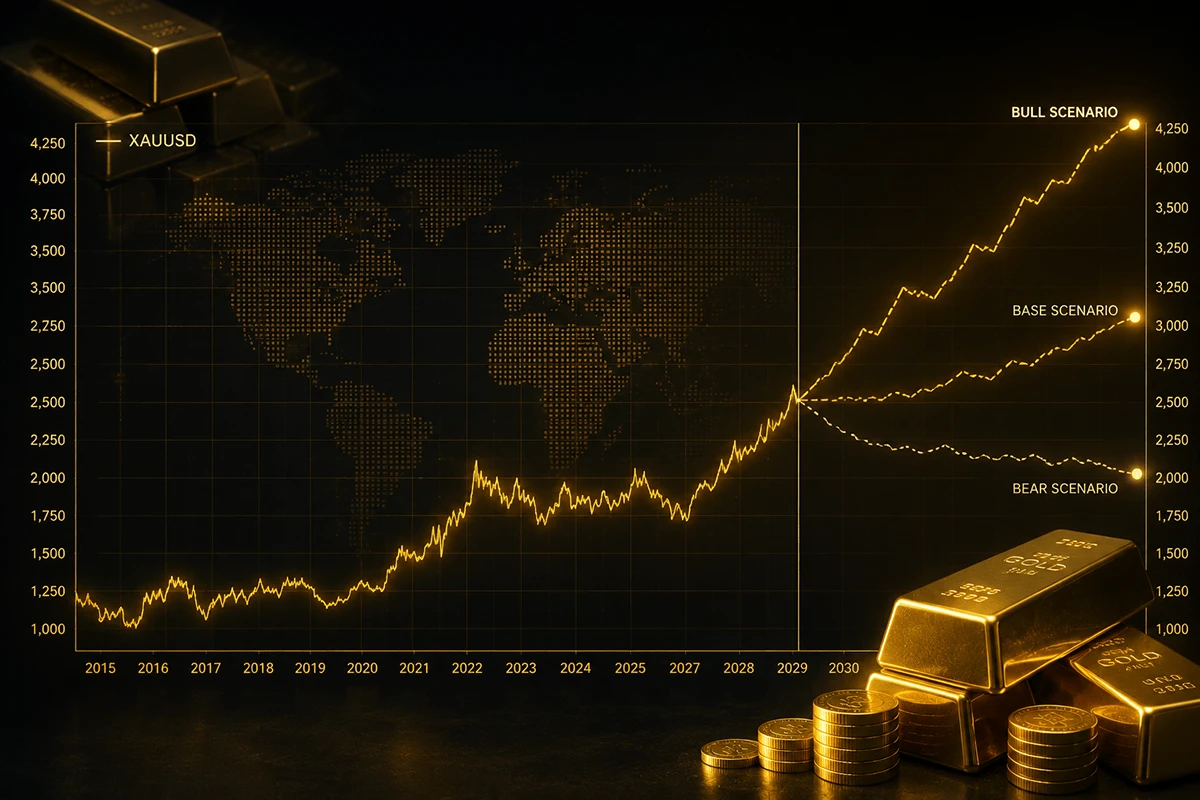
Kịch bản tăng giá: 8.000–10.000+ USD
Điều kiện cần có: USD mất đi vị thế dự trữ đáng kể, Fed kéo dài chu kỳ cắt giảm lãi suất mà không quay lại thắt chặt, hoạt động mua vàng của ngân hàng trung ương tăng tốc vượt quá tốc độ hiện tại, và tỷ trọng phân bổ vào vàng của ETF/nhà đầu tư tổ chức tăng gấp đôi so với hiện tại.
Trong kịch bản này, các chiến lược gia của JPMorgan dự báo vàng có thể đạt 8.000–8.500 USD, được thúc đẩy bởi tỷ trọng phân bổ vàng cao hơn của các hộ gia đình và rủi ro mất giá tài khóa kéo dài. Một số mô hình cấu trúc độc lập, bao gồm các khung định lượng dựa trên động lượng, cho rằng mức giá trên 10.000 USD là hoàn toàn khả thi về mặt toán học nếu lạm phát tích lũy vượt 4% trong suốt thập kỷ trong khi lãi suất thực duy trì gần mức 0.
Đây là kịch bản mà thành tích của vàng trong thế kỷ 21 — vượt trội hơn mọi loại tài sản lớn khác — tiếp tục theo quỹ đạo hiện tại.
Kịch bản cơ sở: 4.000–6.000 USD
Điều kiện cần có: Lạm phát vẫn ở mức cao nhưng không mất kiểm soát, Fed đạt được một chu kỳ cắt giảm lãi suất ở mức vừa phải, USD suy yếu dần, và hoạt động mua của ngân hàng trung ương tiếp tục ở tốc độ hiện tại (~850 tấn mỗi năm).
Kịch bản này phù hợp nhất với khung phân tích của LBMA và mức cơ sở dài hạn của JPMorgan. Vàng duy trì phần bù tài sản thực của mình. Mô hình của Charlie Morris, trong đó đề cập mức 7.000 USD là mục tiêu hợp lý dựa trên giả định lạm phát trung bình 4%, cho thấy vàng sẽ ổn định trong khoảng 5.000–6.000 USD nếu lạm phát ở mức thấp hơn một chút.
Lưu ý: do XAUUSD đã giao dịch trên mức 4.200 USD vào tháng 6 năm 2026, mức thấp của biên độ này sẽ đại diện cho một giai đoạn tích lũy kéo dài nhiều năm hoặc một sự điều chỉnh giảm nhẹ, chứ không phải một đợt phục hồi đáng kể.
Kịch bản giảm giá: 2.500–3.500 USD
Điều kiện cần có: Fed gây bất ngờ cho thị trường với một chu kỳ thắt chặt mới, lợi suất thực tăng vọt lên trên 3%, USD mạnh lên đáng kể, và Bitcoin/tiền điện tử hấp thụ một phần đáng kể dòng vốn phân bổ vào tài sản trú ẩn an toàn.
Kịch bản này đòi hỏi sự đảo chiều của các yếu tố mang tính cấu trúc đã thúc đẩy đà tăng kéo dài cả thập kỷ của vàng. Một cú sốc kiểu Volcker — các đợt tăng lãi suất mạnh tay khiến lợi suất thực tăng cao — là con đường đáng tin cậy nhất dẫn đến mức giá vàng dưới 3.500 USD vào năm 2030. Quá trình phi đô la hóa của các ngân hàng trung ương sẽ cần phải tạm dừng hoặc đảo chiều.
Hầu hết các chuyên gia phân tích kinh tế vĩ mô coi đây là một rủi ro đuôi hơn là một kịch bản cơ sở, nhưng đây vẫn là một kịch bản có thật. Độ nhạy của vàng với lãi suất thực có nghĩa là một cú tăng lợi suất kéo dài chính là mối đe dọa lớn nhất đối với kịch bản tăng giá.
Các chuyên gia phân tích nói gì về vàng năm 2030
JPMorgan đã nâng dự báo giá vàng dài hạn lên 4.500 USD/oz như một mức cơ sở mang tính cấu trúc và đã mô hình hóa một kịch bản tích cực ở mức 8.000–8.500 USD vào cuối thập kỷ, tùy thuộc vào sự gia tăng phân bổ của nhà đầu tư cá nhân. Dự báo ngắn hạn của họ là 5.055 USD/oz vào quý 4 năm 2026, tăng lên 5.400 USD/oz vào cuối năm 2027. Luận điểm của JPMorgan dựa trên rủi ro mất giá tài khóa, sự phân mảnh địa chính trị và tính khó lường trong chính sách của Mỹ.
LBMA / Charlie Morris (Atlantic House Investments): Trên LBMA Alchemist, Morris xây dựng một mô hình định lượng coi vàng như một loại trái phiếu không lãi suất định kỳ, gắn với lạm phát. Sử dụng giả định lạm phát trung bình 4% trong giai đoạn 2020–2030 và lãi suất thực thấp kéo dài, mô hình của ông đưa ra mục tiêu hợp lý là 7.000 USD vào năm 2030. Đây không phải là một mục tiêu giá mang tính đầu cơ — đó là kết quả của một mô hình giá trị hợp lý được chiết khấu với các đầu vào có thể xác định rõ.
Mô hình dự báo của GoldRepublic cung cấp một bảng dự báo theo từng năm, hiện cho thấy vàng ở trong khoảng 5.000–6.500 USD vào giai đoạn 2029–2030 theo các giả định cơ sở.
Tổng kết khách quan: các biên độ dự báo khác nhau đáng kể giứa các chuyên gia phân tích. Khoảng 4.000–7.000 USD đại diện cho kịch bản trung tâm đáng tin cậy. Các kết quả cực đoan — trên 8.000 USD hoặc dưới 3.000 USD — đòi hỏi những điều kiện cụ thể có thể xảy ra hoặc không. Bất kỳ ai khẳng định một mức giá mục tiêu chính xác duy nhất cho năm 2030 đều đang thổi phồng độ chính xác của mô hình của mình.
Để biết phân tích toàn diện hơn về luận điểm đầu tư dài hạn của vàng và ý nghĩa của các dự báo này đối với các nhà giao dịch chủ động, xem Vàng như một khoản đầu tư: Dự báo dài hạn và ý nghĩa đối với các nhà giao dịch XAUUSD.
XAUUSD — Giao dịch vàng thay vì sở hứu vàng
XAUUSD là mã giao dịch cho vàng giao ngay tính theo đô la Mỹ — X đại diện cho kim loại vàng (theo tiêu chuẩn ISO 4217), AU là aurum (tiếng Latinh nghĩa là vàng), USD là đô la Mỹ. Đây là công cụ có tính thanh khoản cao nhất để tiếp cận thị trường vàng, với khối lượng giao dịch hàng ngày lên đến hàng trăm tỷ đô la trên các phiên giao dịch London, New York và châu Á.
Đối với các nhà giao dịch có quan điểm kinh tế vĩ mô về vàng, CFD XAUUSD mang lại khả năng tiếp cận trực tiếp mà không phải chịu chi phí và các vấn đề hậu cần của việc sở hứu vàng vật chất.
Trên MT4/MT5 với NordFX, nhà giao dịch có thể:
- Mua (Long) XAUUSD nếu quan điểm kinh tế vĩ mô là tích cực — hướng đến các kịch bản cơ sở hoặc kịch bản tăng giá nêu trên
- Bán (Short) XAUUSD nếu kịch bản giảm giá (Fed thắt chặt, USD mạnh lên) là luận điểm đang được áp dụng
- Phòng ngừa rủi ro cho vị thế vàng hiện có bằng cách sử dụng một hợp đồng CFD bán khống để bảo vệ trước các đợt điều chỉnh giảm
- Sử dụng đòn bẩy để điều chỉnh mức độ tiếp cận thị trường so với vốn — lưu ý rằng đòn bẩy khuếch đại cả lợi nhuận và thua lỗ. Xem: Quản lý rủi ro khi giao dịch vàng: Xác định quy mô vị thế và kiểm soát biến động.
Để biết các khung chiến lược vào và ra lệnh — giao dịch trong ngày, giao dịch swing, hoặc giao dịch theo xu hướng — xem Chiến lược giao dịch vàng: Giao dịch trong ngày, Swing và theo xu hướng trên XAUUSD.
Đọc Hướng dẫn giao dịch vàng đầy đủ: Cách giao dịch XAUUSD theo từng bước để có một hướng dẫn toàn diện về cách thiết lập nền tảng, các loại lệnh và cách thực hiện giao dịch trên MT4/MT5.
Vì sao các nhà giao dịch CFD chọn vàng nói riêng:
- Phòng ngừa rủi ro danh mục: Vàng có mức tương quan thấp với cổ phiếu; việc bổ sung tiếp cận XAUUSD có thể giúp giảm mức độ biến động của danh mục
- Giao dịch theo kinh tế vĩ mô: Vàng là một trong những công cụ rõ ràng nhất để thể hiện quan điểm về lạm phát, lãi suất thực hoặc sự suy yếu của USD
- Tính thanh khoản cao: XAUUSD giao dịch gần như 24 giờ mỗi ngày, 5 ngày mỗi tuần, với mức chênh lệch giá (spread) hẹp trong các phiên giao dịch chính. Xem: Thời điểm tốt nhất để giao dịch vàng (XAUUSD): Các phiên giao dịch, biến động và tin tức.
- Không cần lưu trợ, không cần bảo quản: Việc tiếp cận qua CFD loại bỏ những trở ngại của việc sở hứu vàng vật chất
Để dự báo XAU USD diễn biến theo hướng kịch bản cơ sở 4.000–7.000 USD, yếu tố xúc tác chính cần theo dõi là quỹ đạo lãi suất thực của Mỹ và dữ liệu mua vàng của các ngân hàng trung ương từ các báo cáo hàng quý của Hội đồng Vàng Thế Giới.
Bạn chưa quen với mã giao dịch này? XAUUSD là gì? Giải thích về vàng so với USD dành cho nhà giao dịch bao gồm toàn bộ thông tin chi tiết về công cụ này, thông số hợp đồng, và sự khác biệt giứa vàng giao ngay và vàng hợp đồng tương lai.
Nhứng rủi ro chính đối với kịch bản tăng giá của vàng
Bất kỳ dự báo nào về vàng cho năm 2030 đều mang tính không chắc chắn đáng kể. Kịch bản tăng giá có nhiều yếu tố hỗ trợ mang tính cấu trúc hơn, nhưng một số tình huống có thể làm chệch hướng kịch bản này:
Lợi suất thực tăng vọt: Nếu Fed đảo ngược hướng đi và triển khai một chu kỳ thắt chặt mới — do lạm phát tăng tốc trở lại hoặc lo ngại về kỷ luật tài khóa — lợi suất thực có thể tăng vọt lên 2–3%. Về mặt lịch sử, một biến động 200–300 điểm cơ bản trong lãi suất thực đã tạo ra các đợt điều chỉnh giảm 20–40% đối với vàng. Đây là rủi ro lớn nhất duy nhất.
Bitcoin là tài sản trú ẩn an toàn cạnh tranh: Câu chuyện ngày càng phổ biến về Bitcoin như "vàng số" không phải là điều nhỏ nhặt. Nếu dòng vốn của các nhà đầu tư tổ chức ngày càng hướng các khoản phân bổ trú ẩn an toàn và phòng ngừa lạm phát về BTC thay vì vàng, điều này sẽ làm phân mảnh nền tảng nhu cầu vốn từ trước đến nay đã hỗ trợ cho vàng. Rủi ro này là có thật nhưng khó định lượng. Để so sánh trực tiếp cách vàng vận động so với USD, JPY và Bitcoin trong các môi trường kinh tế vĩ mô khác nhau, xem: Vàng so với các tài sản trú ẩn an toàn khác (USD, JPY, Bitcoin): Khi nào XAUUSD vượt trội?
Ngân hàng trung ương bán ra: Khó xảy ra dựa trên các xu hướng hiện tại — chưa có ngân hàng trung ương lớn nào phát tín hiệu chuyển sang bán ròng — nhưng vẫn có thể xảy ra nếu một cuộc khủng hoảng nợ quốc gia buộc phải thanh lý tài sản, hoặc nếu động lực địa chính trị chuyển hướng có lợi cho sức mạnh của USD.
Hạ nhiệt địa chính trị: Sự giảm bớt rộng rãi các căng thẳng địa chính trị sẽ làm giảm phần bù rủi ro mang tính cấu trúc đang được phản ánh trong giá vàng hiện tại. Ít xung đột hơn = ít nhu cầu trú ẩn an toàn hơn = áp lực giảm giá nhẹ đối với vàng.
Câu hởi thường gặp
Vàng sẽ có giá trị bao nhiêu vào năm 2030?
Hầu hết các mô hình phân tích cho rằng vàng có thể giao dịch trong khoảng 4.000 – 7.000 USD mỗi ounce vào năm 2030 theo các giả định kịch bản cơ sở. JPMorgan đã mô hình hóa một kịch bản tích cực ở khoảng 8.000–8.500 USD nếu tỷ trọng phân bổ của nhà đầu tư cá nhân vào vàng tăng đáng kể. Mô hình định lượng của LBMA (Alchemist Số 97) xác định mức 7.000 USD là mục tiêu hợp lý dựa trên lạm phát trung bình 4% trong thập kỷ. Các kịch bản giảm giá — đòi hỏi Fed thắt chặt mạnh tay và USD mạnh lên — đưa giá vàng năm 2030 về gần mức 2.500–3.500 USD. Không có mô hình nào cung cấp một con số chính xác duy nhất; biên độ này phản ánh sự không chắc chắn thực sự của kinh tế vĩ mô.
Vàng có đạt mức 5.000 USD mỗi ounce vào năm 2030 không?
Vàng đã đạt mức cao nhất lịch sử là 5.597 USD vào tháng 1 năm 2026. Việc vàng có duy trì hoặc trở lại mức đó vào năm 2030 hay không phụ thuộc vào lộ trình lãi suất của Fed, quỹ đạo USD, và việc hoạt động mua của ngân hàng trung ương có tiếp tục ở tốc độ hiện tại hay không. Theo các giả định kịch bản cơ sở, các chuyên gia phân tích cho rằng mức 5.000 USD là khả thi — nhưng hiệu suất trong quá khứ không đảm bảo cho kết quả trong tương lai.
Vàng có phải là một khoản đầu tư tốt cho năm 2030 không?
Đây không phải là lời khuyên đầu tư. Về mặt lịch sử, vàng đóng vai trò là công cụ phòng ngừa lạm phát, đa dạng hóa danh mục và tài sản trú ẩn an toàn — và các vai trò này vẫn còn nguyên giá trị trong điều kiện kinh tế vĩ mô hiện tại. Sự phù hợp của từng cá nhân phụ thuộc vào tình hình tài chính, mức độ chấp nhận rủi ro và mục tiêu đầu tư của bạn. Hãy tham khảo ý kiến của một cố vấn tài chính có chuyên môn trước khi đưa ra quyết định đầu tư.
Dự báo giá vàng trong 5 năm tới là gì?
Từ mức hiện tại (~4.260 USD vào tháng 6 năm 2026) đến năm 2031, các mô hình phân tích cho rằng vàng có thể giao dịch trong một biên độ rộng tùy thuộc vào điều kiện kinh tế vĩ mô: khoảng 3.500–8.500+ USD trên toàn bộ dải kịch bản. Quỹ đạo kịch bản cơ sở cho thấy sự tăng giá dần dần, được thúc đẩy bởi nhu cầu bền vững của ngân hàng trung ương, sự thu hẹp lãi suất thực và áp lực mang tính cấu trúc đối với USD. Các biến động mạnh theo cả hai hướng đều có thể xảy ra nếu lợi suất thực tăng vọt hoặc giảm nhanh hơn.
Làm thế nào để giao dịch vàng (XAUUSD) trực tuyến?
XAUUSD (vàng giao ngay so với USD) có thể được giao dịch dưới dạng CFD trên MT4 hoặc MT5. Xem hướng dẫn từng bước Kiến thức cơ bản về giao dịch vàng: Cách giao dịch XAUUSD trên MT4/MT5 — mở tài khoản thực hoặc demo, nạp tiền, và đặt lệnh mua (long) hoặc bán (short) trên XAUUSD. Tài khoản demo cho phép bạn thực hành với giá thị trường thực mà không có rủi ro về vốn thực trước khi giao dịch thực.
Kết luận
Dự báo giá vàng cho năm 2030 trải rộng trên một biên độ lớn, nhưng phần lớn quan điểm của các chuyên gia phân tích và các bằng chứng kinh tế vĩ mô mang tính cấu trúc đều hướng đến một kịch bản cơ sở là 4.000–7.000 USD mỗi ounce. Các kịch bản đáng tin cậy nhất — biên độ 4.500–8.500 USD của JPMorgan, mô hình 7.000 USD của LBMA, và xu hướng mua của ngân hàng trung ương được Hội đồng Vàng Thế Giới theo dõi — đều hội tụ về một sự tăng giá bền vững của vàng, được thúc đẩy bởi sự thu hẹp lãi suất thực, sự suy yếu của USD và nhu cầu dai dẳng từ ngân hàng trung ương.
Các kết quả cực đoan tồn tại theo cả hai hướng. Một cú sốc chính sách kiểu Volcker có thể đẩy vàng trở lại mức 2.500–3.500 USD. Một sự sụp đổ hoàn toàn vị thế dự trữ của USD, kết hợp với việc tiếp tục kìm giữ lãi suất và quá trình phi đô la hóa đang tăng tốc, có thể đưa XAUUSD hướng tới mức 10.000 USD.
Đối với các nhà giao dịch và nhà đầu tư, câu hỏi thực tế không phải là mức giá chính xác nào là "đúng" — mà là liệu các điều kiện kinh tế vĩ mô đã thúc đẩy đà tăng lịch sử của vàng có khả năng tiếp tục duy trì hay không. Dụ liệu dự báo XAU USD từ các tổ chức lớn cho thấy các điều kiện đó vẫn phần lớn còn nguyên vẹn cho đến cuối thập kỷ.
Giao dịch vàng (XAUUSD) trên NordFX — tiếp cận thị trường vàng qua MT4/MT5 với mức chênh lệch giá hẹp. Mở một tài khoản demo miễn phí và giao dịch XAUUSD với giá thị trường thực, không có rủi ro về vốn thực.
Các dự báo giá vàng mang lại bối cảnh dài hạn hứu ích, nhưng việc giao dịch thành công cũng phụ thuộc vào việc hiểu rõ điều kiện thị trường hiện tại. Tiếp tục với: Vì sao bây giờ là thời điểm hoàn hảo để giao dịch vàng.
Đây không phải là lời khuyên giao dịch và chỉ được cung cấp cho mục đích giáo dục.

