.webp)
Apakah itu CFD gas asli? Ia adalah Kontrak untuk Perbezaan ke atas harga gas asli Henry Hub – penanda aras AS yang didagangkan di NYMEX – yang membolehkan anda berspekulasi sama ada harga gas akan naik atau turun tanpa perlu menerima penghantaran fizikal walau satu unit bahan api. Di NordFX, gas asli didagangkan di bawah simbol NATGAS, tersedia merentas semua jenis akaun dengan leveraj sehingga 1:1000.
Gas asli adalah antara pasaran komoditi paling tidak menentu di dunia. Harganya boleh bergerak 10–20% dalam beberapa hari akibat cuaca sejuk mendadak, gangguan bekalan, atau perubahan permintaan eksport LNG. Bagi pedagang yang memahami pemacunya, ketidaktentuan itu adalah peluang dan bukan bunyi bising.
Apakah Itu CFD Gas Asli?
Apabila anda membuka kedudukan NATGAS, anda tidak membeli gas sebenar. Anda memasuki kontrak di mana untung atau rugi ditentukan sepenuhnya oleh perbezaan antara harga masuk dan keluar anda, didarabkan dengan saiz kedudukan anda.
Struktur ini memberi anda dua keupayaan. Anda boleh membuka kedudukan long – membeli NATGAS jika anda menjangkakan harga akan naik – atau short – menjual jika anda menjangkakan harga akan turun. Tiada satu pun memerlukan pemilikan komoditi pendasar.
Henry Hub ialah titik penanda aras harga: persimpangan saluran paip di Louisiana di mana beberapa saluran paip antara negeri utama bersilang, menjadikannya rujukan paling cair untuk gas asli Amerika Utara. Apabila berita kewangan menyebut "harga gas", ia hampir selalu bermaksud Henry Hub – dan itulah harga yang dijejaki oleh CFD NATGAS anda.
Harga disebut dalam dolar AS setiap MMBtu (juta Unit Terma British). Di NordFX, satu lot standard NATGAS mewakili 10,000 MMBtu. Pergerakan harga $0.10 bersamaan $1,000 setiap lot. Lot mini (0.1 lot) menghasilkan $100 untuk pergerakan yang sama. Memahami hubungan ini sebelum menentukan saiz kedudukan bukan pilihan – gas asli kerap bergerak $0.30–$0.50 dalam satu sesi.
Mengapa Harga Gas Asli Sangat Tidak Menentu
Permintaan gas asli sangat bermusim; bekalannya pula lambat berubah. Gabungan itu menghasilkan turun naik harga yang mengatasi kebanyakan instrumen lain.
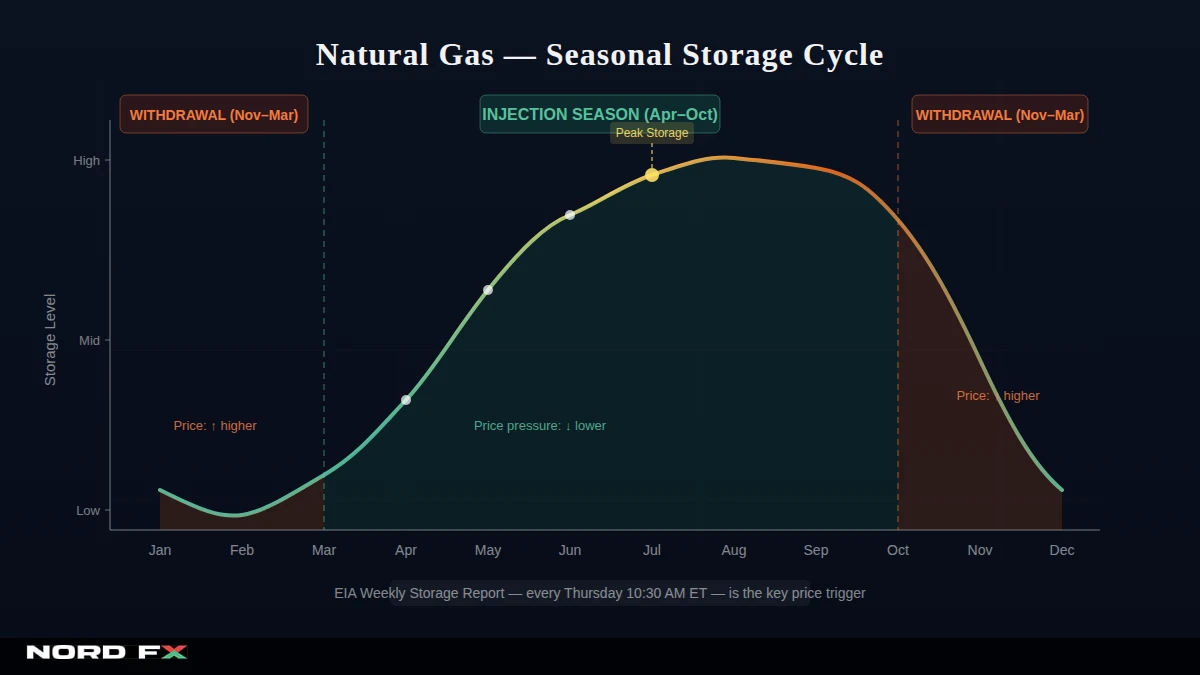
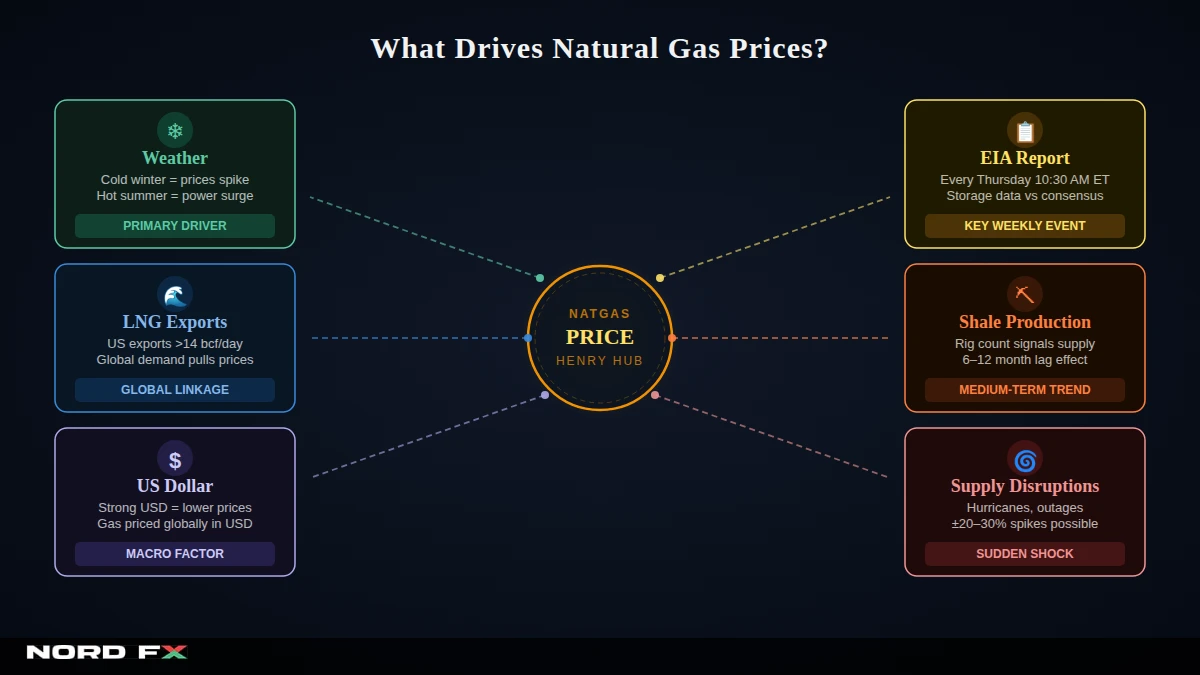
Cuaca adalah pemacu jangka pendek yang dominan. Gas adalah bahan api pemanas utama di seluruh AS dan Eropah. Musim sejuk yang luar biasa sejuk akan mengurangkan storan dengan cepat dan menolak harga naik dengan tajam. Musim sejuk yang sederhana meninggalkan inventori penuh dan harga tertekan. Haba musim panas yang melampau juga penting – penjanaan kuasa berasaskan gas melonjak seiring permintaan penghawa dingin.
Laporan Storan Mingguan EIA adalah peristiwa berkala paling penting. Setiap Khamis pada 10:30 pagi Waktu Timur, Pentadbiran Maklumat Tenaga AS menerbitkan jumlah gas yang disuntik ke dalam atau dikeluarkan dari storan bawah tanah AS berbanding purata lima tahun. Pengeluaran yang lebih besar daripada anggaran konsensus mendorong harga naik serta-merta; suntikan yang lebih besar daripada jangkaan menolaknya turun. Reaksinya kerap 3–8% dalam beberapa minit.
Eksport LNG telah mengglobalkan pasaran. Sebelum AS menjadi pengeksport LNG utama, Henry Hub hampir keseluruhannya cerita domestik. Kini, dengan kapasiti eksport AS melebihi 14 bilion kaki padu sehari, pasaran gas Eropah atau Asia yang ketat boleh menarik inventori AS lebih rendah dan menaikkan harga Henry Hub walaupun pada musim yang biasanya sunyi. Peristiwa geopolitik – gangguan bekalan Rusia, ketidakstabilan Timur Tengah – semakin relevan.
Pengeluaran dan kiraan rig mengawal jangka sederhana. Industri gas syal AS bertindak balas terhadap isyarat harga. Apabila Henry Hub naik melebihi sekitar $3.50–$4.00/MMBtu, pengeluar mempercepat penggerudian dan output meningkat dalam tempoh enam hingga dua belas bulan. Apabila harga jatuh di bawah kos pengeluaran, rig diberhentikan. Kiraan rig Baker Hughes mingguan memberi pedagang petunjuk awal kitaran ini.
Taufan menyebabkan lonjakan mendadak. Cuaca buruk yang menggangu infrastruktur Pantai Teluk boleh menolak harga gas naik 20–30% dalam beberapa hari – dan berbalik dengan tajam apabila pengeluaran disambung semula.
Cara Berdagang CFD Gas Asli di NordFX
Langkah 1: Buka akaun anda. NATGAS tersedia pada semua akaun NordFX. Akaun MT4 Pro bermula dari hanya $10 dan merupakan titik masuk praktikal. Untuk pelaksanaan ECN dan spread lebih ketat, akaun MT4 Zero dan MT5 Zero bermula dari $100 dan $200 masing-masing. Sebelum menggunakan modal sebenar, buka akaun demo percuma – ia mereplikasi keadaan pasaran langsung dengan tepat, jadi anda boleh berlatih dagangan NATGAS dengan risiko kewangan sifar.
Langkah 2: Cari NATGAS di MetaTrader. Dalam panel Market Watch, cari simbol NATGAS. Klik kanan untuk membuka carta dan perhatikan sejarahnya. Anda akan cepat mengenal pasti irama bermusim – pengeluaran musim sejuk, paras rendah musim peralihan, lonjakan permintaan kuasa musim panas – yang mentakrifkan instrumen ini.
Langkah 3: Analisis sebelum bertindak. Semak tahap storan semasa berbanding purata bermusim lima tahun: storan di bawah purata memberikan sokongan harga struktur; storan di atas purata mengehadkan kenaikan. Tindihkan pandangan asas anda dengan analisis teknikal. Moving Averages, RSI, dan Bollinger Bands MetaTrader semuanya berkesan pada NATGAS, yang bertrend kuat semasa peristiwa cuaca dan menggabung semasa keadaan sederhana. Analisis pasaran mingguan NordFX meliputi pasaran tenaga bersama forex dan komoditi lain, memberi anda tahap teknikal dan konteks makro di satu tempat.
Langkah 4: Tentukan saiz kedudukan dan tetapkan kawalan risiko. Kerana gas asli tidak menentu, penentuan saiz kedudukan lebih penting di sini berbanding kebanyakan pasaran. Pendekatan berhati-hati adalah mempertaruhkan tidak lebih daripada 1–2% modal akaun setiap dagangan, kemudian mengira saiz lot daripada jarak Stop Loss anda. Sentiasa letakkan Stop Loss sebelum pelaksanaan. Sentiasa tetapkan Take Profit pada sasaran realistik supaya pengambilan keuntungan automatik dan bukan emosi. Di MetaTrader, kedua-duanya ditetapkan dalam tetingkap pesanan pada saat anda membuka dagangan.
Langkah 5: Tentukan masa kemasukan anda. Memasuki sebelum laporan storan EIA Khamis tanpa keyakinan arah adalah spekulasi, bukan analisis. Ramai pedagang NATGAS berpengalaman menutup kedudukan sebelum keluaran dan masuk semula apabila lonjakan awal mereda – atau menahan hanya apabila pandangan asas mereka cukup kuat untuk menempuh ketidaktentuan.
Langkah 6: Pantau dan tutup. NATGAS didagangkan hampir sepanjang masa pada hari bekerja. Tidak seperti niaga hadapan, CFD gas asli NordFX tiada tarikh luput tetap, jadi anda menutup apabila analisis anda menyatakan demikian – bukan kerana kontrak sedang digolek.
Contoh Praktikal
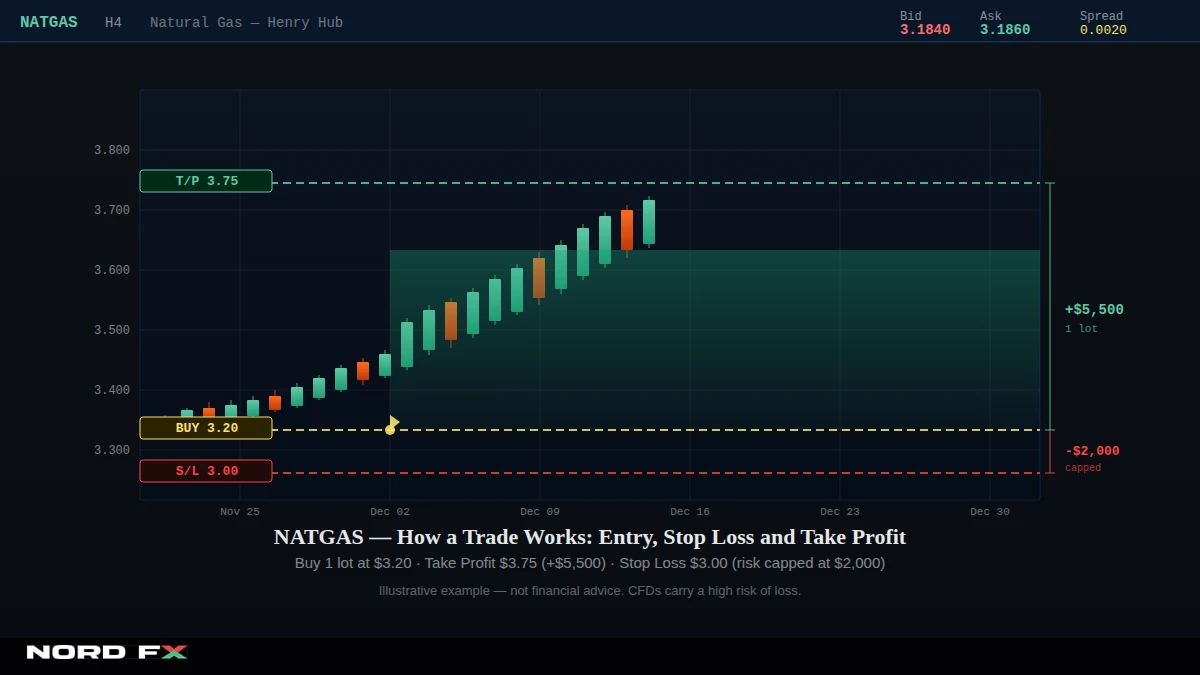
NATGAS didagangkan pada $3.20/MMBtu pada akhir November. Ramalan cuaca menunjukkan Disember yang luar biasa sejuk di seluruh AS benua, dan laporan EIA terkini menunjukkan pengeluaran lebih besar daripada konsensus. Anda membuka kedudukan beli untuk 1 lot.
Harga naik kepada $3.75 dalam tempoh tiga minggu. Keuntungan kasar: ($3.75 − $3.20) × 10,000 = $5,500.
Sekiranya harga jatuh kepada $2.90 sebaliknya – cuaca panas pertengahan musim sejuk tiba secara tidak dijangka – dan Stop Loss anda ditetapkan pada $3.00, kerugian anda akan dihadkan pada ($3.20 − $3.00) × 10,000 = $2,000, tanpa mengira ke mana harga pergi selepas itu. Tanpa Stop Loss tersebut, kerugian pada $2.90 ialah $3,000. Gas boleh jatuh lebih cepat dan lebih jauh daripada jangkaan kebanyakan pedagang apabila corak cuaca berbalik.
Kesilapan Biasa Semasa Berdagang CFD Gas Asli
Menganggap gas asli seperti minyak mentah. Brent dan WTI bertindak balas terutamanya kepada keputusan OPEC dan geopolitik. NATGAS dipacu sangat banyak oleh cuaca dan storan domestik. Pedagang yang menggunakan rangka kerja pasaran minyak terhadap gas secara konsisten salah membaca masa dan magnitud pergerakan.
Mengabaikan konteks bermusim. Harga gas mengikuti irama bermusim yang boleh dipercayai – storan dikeluarkan sepanjang musim sejuk, diisi semula pada musim bunga dan musim panas, dikeluarkan semula pada musim sejuk berikutnya. Harga yang kelihatan "tinggi" pada Februari mungkin sangat munasabah memandangkan betapa sedikitnya musim sejuk yang berbaki; harga yang sama pada Oktober memberi isyarat sesuatu yang sangat berbeza tentang prospek bekalan.
Berdagang ke dalam laporan EIA tanpa pandangan. Keluaran storan Khamis menggerakkan NATGAS 3–8% dalam beberapa minit. Kedudukan tanpa arah atau bersaiz buruk semasa keluaran tersebut adalah salah satu sumber paling biasa kerugian tidak dijangka di pasaran ini.
Memandang rendah leveraj pada instrumen tidak menentu. Dengan leveraj sehingga 1:1000 tersedia di NordFX, walaupun pergerakan $0.10 – yang berada dalam julat harian biasa – menghasilkan ayunan $1,000 setiap lot standard. Kebanyakan pedagang baharu menemui ini semasa sesi tidak menentu pertama mereka, bukan sebelumnya.
Melupakan yuran swap semalaman. Kedudukan berbilang minggu di NATGAS – sangat munasabah memandangkan trend bermusimnya – mengumpul kos pegangan yang mesti dikira sebelum dagangan dibuka, bukan selepas ia berjalan selama tiga minggu.
Apa yang Perlu Dilakukan Seterusnya
Buka akaun demo NordFX percuma, cari NATGAS di MetaTrader, dan berlatih dagangan CFD gas asli pertama anda dengan modal maya. Perhatikan bagaimana harga bertindak balas terhadap setiap laporan storan EIA Khamis. Kaji sekurang-kurangnya satu musim pemanasan penuh data harga sejarah. Apabila anda telah membentuk pandangan berdasarkan tahap storan dan ramalan cuaca, laksanakannya dengan Stop Loss – dan semak hasilnya.
Apabila anda bersedia untuk beralih ke akaun langsung, bandingkan akaun dagangan NordFX dan pilih struktur yang sesuai dengan gaya dagangan anda. Jika anda baharu kepada mekanik CFD secara amnya, Pusat Pembelajaran NordFX meliputi margin, leveraj, dan pengurusan risiko dengan jelas – bacaan berbaloi sebelum berdagang salah satu instrumen paling bertenaga di pasaran.
Soalan Lazim
Apakah itu CFD gas asli? Instrumen derivatif yang membolehkan anda berspekulasi pada harga gas Henry Hub tanpa memiliki gas fizikal. Untung dan rugi ditentukan oleh pergerakan harga didarabkan dengan saiz kedudukan.
Apakah yang paling menggerakkan harga gas asli? Cuaca adalah pemacu utama. Laporan Storan Mingguan EIA, diterbitkan setiap Khamis pada 10:30 pagi ET, adalah peristiwa berkala paling konsisten menggerakkan pasaran. Permintaan eksport LNG dan tahap pengeluaran mengawal trend jangka sederhana.
Apakah yang diwakili oleh satu lot NATGAS di NordFX? 10,000 MMBtu. Pergerakan harga $0.10 bersamaan $1,000 setiap lot standard; lot mini (0.1) menghasilkan $100.
Bilakah masa terbaik untuk berdagang NATGAS? Kecairan memuncak semasa sesi AS, 09:30–16:00 ET. Laporan EIA Khamis pada 10:30 pagi ET menjana pergerakan intraday paling tajam. Musim pemanasan Oktober–Mac menghasilkan trend berarah paling berterusan.
Adakah CFD NATGAS di NordFX luput seperti kontrak niaga hadapan? Tidak. Tiada tarikh luput tetap. Anda menutup kedudukan apabila analisis anda menyuruh demikian, dengan syarat margin mencukupi – jauh lebih mudah diurus berbanding niaga hadapan gas didagangkan di bursa.

